

Bitcoin (BTC) bulls ran into a wall of resistance at $43,500 on Tuesday as attempts to push the price action higher have thus far been stymied following yesterday’s 3.3% rally back above prior resistance at $42,000.
Data from TradingView shows that bulls and bears are evenly matched at present, putting Bitcoin squarely in the middle of its daily trading range of $43,125 and $43,875 at the time of writing.

BTC/USD Chart by TradingView
While Grayscale has continued to experience outflows – which have been the main source of negative pressure in the market – the other listed ETFs are helping to make up the difference.
Data provided by Farside Investors shows that the flows into Fidelity’s spot Bitcoin ETF (FBTC) hit $208 million on Monday, while BlackRock’s IBIT increased by $198 million. GBTC experienced $192 million in outflows, and when the flows for all products are combined, there was a net increase of $254 million.
The $192 million pulled from Grayscale also represented the lowest daily level of outflows since the other products launched, a sign that the selling pressure is beginning to subside.
As of Monday evening, the net flow for all spot BTC ETFs was $1.014 billion.
Technical analyst Gert van Lagen provided an update on Tuesday’s flows, which showed a positive net flow of 4,000 BTC.
Update on daily ETF inflows (green) minus daily GBTC outflows (red)
+ The daily net effect (cyan) has flipped positive again to +4,000 $BTC
Roughly:
+ GBTC: ~120,000 BTC out
+ other ETFS: ~140,000 BTC in
Link to spreadsheet: https://t.co/C1woMwLplM pic.twitter.com/BmLgV4gdj4— Gert van Lagen (@GertvanLagen) January 30, 2024
While the move higher for BTC over the past day was a welcome sight for many expecting a deeper selloff, market analyst Rekt Capital warned that Bitcoin is not out of the woods yet, and a correction lower is still a strong possibility.
“There we have it. Bitcoin revisited the ~$43800 Range High resistance,” Rekt Capital tweeted. “At this time, Bitcoin is forming a new Lower High to the early January candle-bodied highs.”
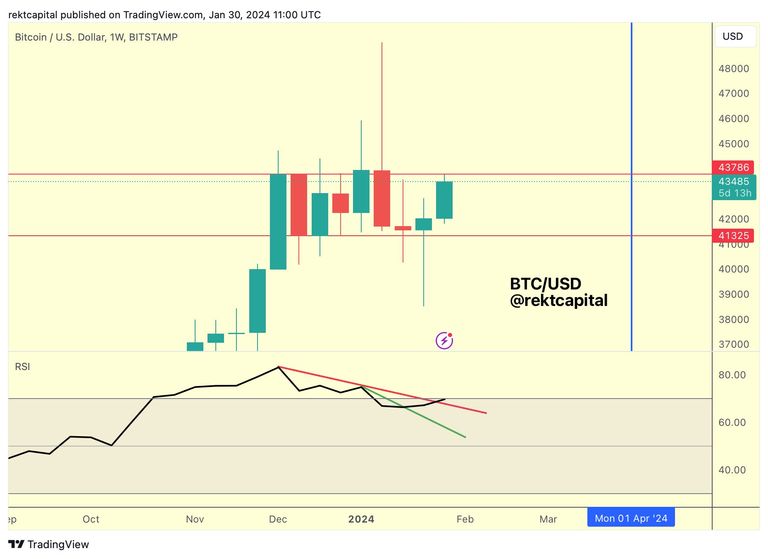
BTC/USD 1-week chart. Source: X
“Trying hard to invalidate its Weekly Bearish Divergence (which arguably already played out on last week's dip),” he said in a follow-up post. “The RSI is already pressing beyond its downtrend (red).”
Market analyst CryptoGodJohn highlighted resistance at $44,000 as the level to watch to determine how Bitcoin’s price will perform in the near term.
Key level for $BTC is $44,400 what happens at this retest will be telling
Above = clear skies to $50k+
Rejection = $40k retest possibly new lows pic.twitter.com/XHq1Eyrsoj— Johnny (@CryptoGodJohn) January 30, 2024